Optimize Web Perfromance #
Web apps are now more interactive than ever. Getting that last drop of performance can do a great deal to improve your end-users’ experience. Read the following guidance and learn if there is anything more you can do to improve latency, render times and general performance!
A Faster Web App #
Optimizing web apps can be an arduous job. Not only are web apps split in client-side and server-side components, but they are also usually built using diverse technology stacks: there’s the database, the backend components (which are usually built on a stack of different technologies as well), the frontend (HTML + JavaScript + CSS + transpilers). Runtimes are diverse too: iOS, Android, Chrome, Firefox, Edge. If you come from a different, monolithic platform, where optimization is usually done against a single target (and even a single version of that target), you will probably reason this is a much more complex task. This can be correct. There are, however, common optimization guidelines that go a long way into improving an app. We will explore these guidelines in the following sections.
A Bing study found that a 10ms increase in page load time costs the site $250K in revenue annually. - Rob Trace and David Walp, Senior Program Managers at Microsoft
Premature Optimization? #
The hard thing about optimization is finding the right point in the development life-cycle to do it. Donald Knuth famously said “premature optimization is the root of all evil*”. The reasoning behind these words is quite simple: it is quite easy to lose time gaining that last 1% of performance in places where it won’t make a significant impact. At the same time, some optimizations hinder readability or maintainability, or even introduce newer bugs.
In other words, optimization should not be considered a “means to get the best performance out of an application”, but “the search for the right way to optimize an app and get the biggest benefits”. In other words, blind optimization can result in lost productivity and small gains. Keep this in mind when applying the following tips. Your biggest friend is the profiler: find the performance hotspots you can optimize to get the biggest improvements without impairing the development or maintainability of your app.
“Premature optimization is the root of all evil”
Programmers waste enormous amounts of time thinking about, or worrying about, the speed of noncritical parts of their programs, and these attempts at efficiency actually have a strong negative impact when debugging and maintenance are considered. We should forget about small efficiencies, say about 97% of the time: premature optimization is the root of all evil. Yet we should not pass up our opportunities in that critical 3%. - Donald Knuth
Determining what to optimize #
The best way to start is to critically look at your websites actual performance. My favorite, and the first tool that I reach for, when examining an application or site is Lighthouse. Lighthouse is an amazing tool which can be automated to help identify and make recommendations on improving the quality of your web pages. I highly recommend that you download this tool (It has a nice Chrome plugin) and test your application or site under it before ever touching a line of code, HTML, CSS, or a webserver setting.
It can be used on local applications as well as already deployed sites that can be reached from the local browser. This tool also has a robust CLI (Command Line Interface) that can be easily incorporated into your CI/CD pipeline to provide automated reports and recommendations whenver a site is built.
Other fine tools in this area include: GTMetrix and PageSpeed. All are very similar and all will give similar, although not identical, findings and recommendations.
While these tools will give you response times and recommendations for every page that you visit, before even starting on any work (even for a terribly slow page) there are several things that you should consider.
Let’s assume that you have identified a number of pages and run a tool such as Lighthouse to identify slow pages and what is contributing to them being slow. Should you just start in on the slowest page? NO. You should combine the information gathered from your tool of choice with and understanding of which of those pages will have the highest impact if performance is improved.
Let’s take an example, consider four pages found in a typical application: login, account profile, a report page, and a home list page of details. Which pages will be hit by a user the most often? Obviously, it would important to have actual numbers or history for how often these pages are hit rather than guessing - but, it is possible to make some assumptions based on a cursory understanding of the application.
- It makes sense that EVERY user will hit the login page at least once. It is also the first page that users will see and it is definitely has an important impact on the users perceived performance of the application.
- The profile page gives the user the option to view and edit their account details. While this page is important, we can assume that it is probably not a page that users will hit every time they are within an application - in fact, it is safe to say that it might be hit only rarely.
- The home list page is the page hit and displayed post login and is going to be hit at least once every session and likely more than once - this would be a very common page and it is likely that it would be hit multiple times during every user session.
- The report page is likely to be hit only occasionally when a user needs to generate a specific report for consumption outside of the application.
Given these assumptions, the two primary pages that should probably be targeted first would be the login and home list screens. Even if the other pages are determined to be simpler to improve, the biggest “bang-for-the-buck” are these two pages.
Of course, the complexity of performance improvements may be such that they would cost too much to completely resolve or have impacts on other aspects of the application.
Thirteen Optimizations for the Web #
JavaScript minification and module bundling #
JavaScript apps are distributed in source-code form. Source-code parsing is less efficient than bytecode parsing. For short scripts, the difference is negligible. For bigger apps, however, script size can have a negative impact in application startup time. In fact, one of the biggest improvements expected from the use of WebAssembly are better startup times. Minification is the process of processing source-code to remove all unnecessary characters without changing functionality. This results in (unreadable) shorter code that can be parsed faster.
On the other hand, module bundling deals with taking different scripts and bundling them together in a single file. Fewer HTTP requests and a single file to parse reduces load times. Usually, a single tool can handle bundling and minification. Webpack is one of those tools.
For example this code:
function insert(i) {
    document.write("Sample " + i);
}

for(var i = 0; i < 30; ++i) {
    insert(i);
}
Results in:
!function(r){function t(o){if(e[o])return e[o].exports;var n=e[o]={exports:{},id:o,loaded:!1};return r[o].call(n.exports,n,n.exports,t),n.loaded=!0,n.exports}var e={};return t.m=r,t.c=e,t.p="",t(0)}([function(r,t){function e(r){document.write("Sample "+r)}for(var o=0;30>o;++o)e(o)}]);
//# sourceMappingURL=bundle.min.js.map
Further bundling #
You can also bundle CSS files and combine images with Webpack. These features can also help improve startup times. Explore the docs and run some tests!
On-demand loading of assets #
On-demand or lazy loading of assets (images in particular) can help greatly in achieving better general performance of your web app. There are three benefits to lazy loading for image-heavy pages:
- Reduced number of concurrent requests to the server (which results in faster loading times for the rest of your page).
- Reduced memory usage in the browser (fewer images, less memory).
- Reduced load on the server.
The general idea is to load images or assets (such as videos) at the moment they are being displayed for the first or the moment they are about to get displayed. Since this is deeply connected to how you build your site, lazy loading solutions usually come in the form of plugins or extensions to other libraries. For instance, react-lazy-load is a plugin to handle lazy loading of images for React:
const MyComponent = () => (
  <div>
    Scroll to load images.
    <div className="filler" />
    <LazyLoad height={762} offsetVertical={300}>
      <img src='http://apod.nasa.gov/apod/image/1502/HDR_MVMQ20Feb2015ouellet1024.jpg' />
    </LazyLoad>
    (...)
A great sample of how this looks in practice is the Google Images search tool. Click on the previous link and scroll the page to see the effect.
Use array-ids when using DOM manipulation libraries #
If you are using React, Ember, Angular or other DOM manipulation libraries, using array-ids (or the track-by feature in Angular 1.x) can help a great deal in achieving good performance, in particular for dynamic sites. We saw the effects of this feature in a recent benchmarks article: More Benchmarks: Virtual DOM vs Angular 1 & 2 vs Mithril.js vs cito.js vs The Rest (Updated and Improved!).
The main concept behind this feature is to reuse as much existing nodes as possible. Array ids allow DOM-manipulation engines to “know” when a certain node can be mapped to a certain element in an array. Without array-ids or track-by most libraries resort to destroying the existing nodes and creating new ones. This impairs performance.
Cache #
Caches are components that store static data that is frequently accessed so that subsequent requests to this data can be served faster or in a more efficient way. As web apps are composed of many moving parts, caches can be found in many parts of their architecture. For instance, a cache may be put in place between a dynamic content server and clients to prevent common request from increasing the load of the server and at the same time improving the response time. Other caches may be found in-code, optimizing certain common access patterns specific to the scripts in use. Other caches may be put in front of databases or long-running processes.
In short, caches are a great way to improve response times and reduce CPU use in web applications. The hard part is getting to know which is the right place for a cache inside an architecture. Once again the answer is profiling: where are the common bottlenecks? Are the data or results cacheable? Are they invalidated too easily? These are all hard questions that need to be answered on a case by case basis.
Uses of caches can get creative in web environments. For example, there is basket.js, a library that uses Local Storage to cache scripts for your app. So the second time your web app runs scripts are loaded almost instantaneously.
A popular caching service nowadays is Azure CDN. Azure CDN works as a general purpose content distribution network (CDN) that can be setup as a cache for dynamic content.
Enable HTTP/2 #
More and more browsers are starting to support HTTP/2. This may sound superfluous but HTTP/2 introduces many benefits for concurrent connections to the same server. In other words, if there are many small assets to load (and there shouldn’t if you are bundling things!), HTTP/2 kills HTTP/1 in latency and performance. Check Akamai’s HTTP/2 demo on a recent browser to see the difference.

Profile Your App #
Profiling is an essential step in optimizing any application. As mentioned in the introduction, blindly trying to optimize an app often results in lost productivity, negligible gains and harder maintainability. Profiling runs are an essential step in identifying your application hotspots.
When it comes to web applications, latency is one of the biggest complaints, so you want to make sure data is loading and getting displayed as fast as possible. Chrome provides great profiling tools. In particular, both the timeline view and the network view from Chrome’s Dev Tools help greatly in finding latency hotspots:
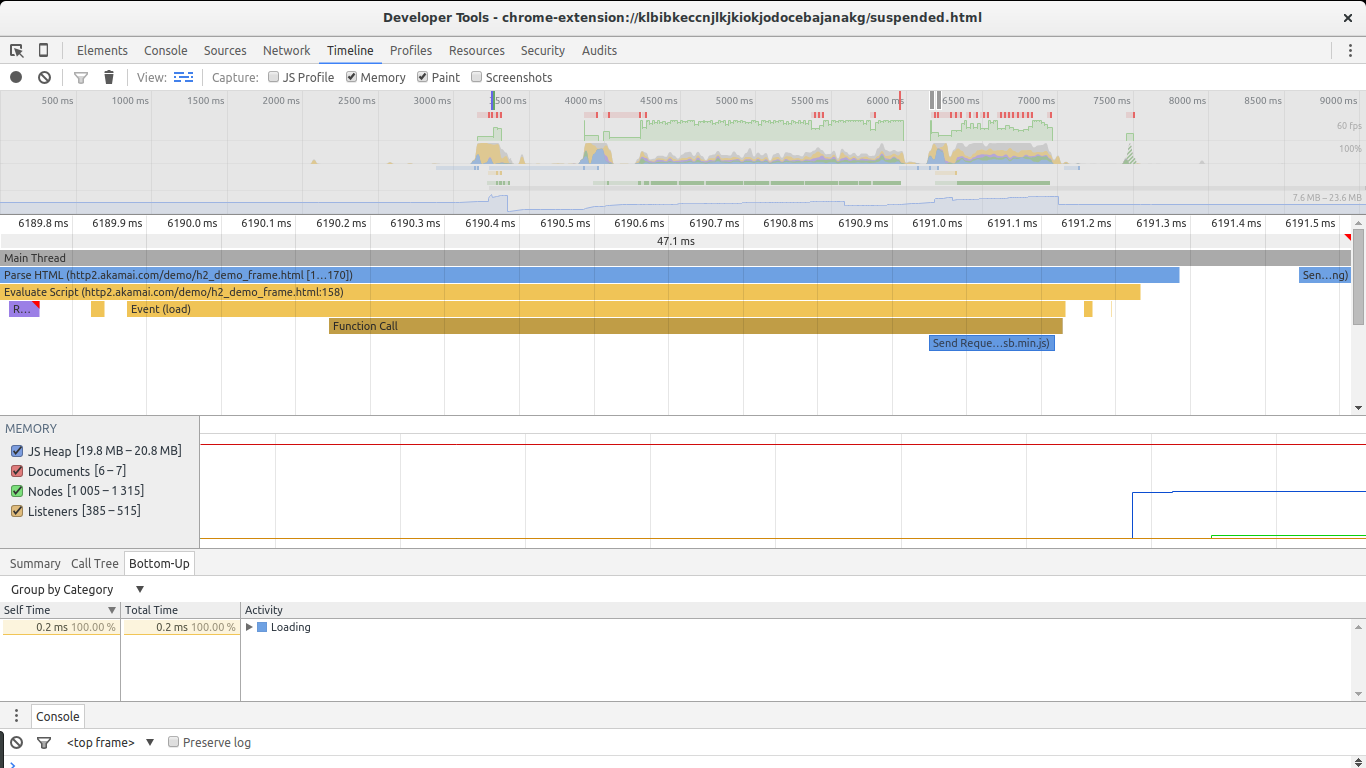
The timeline view can help in finding long running operations.
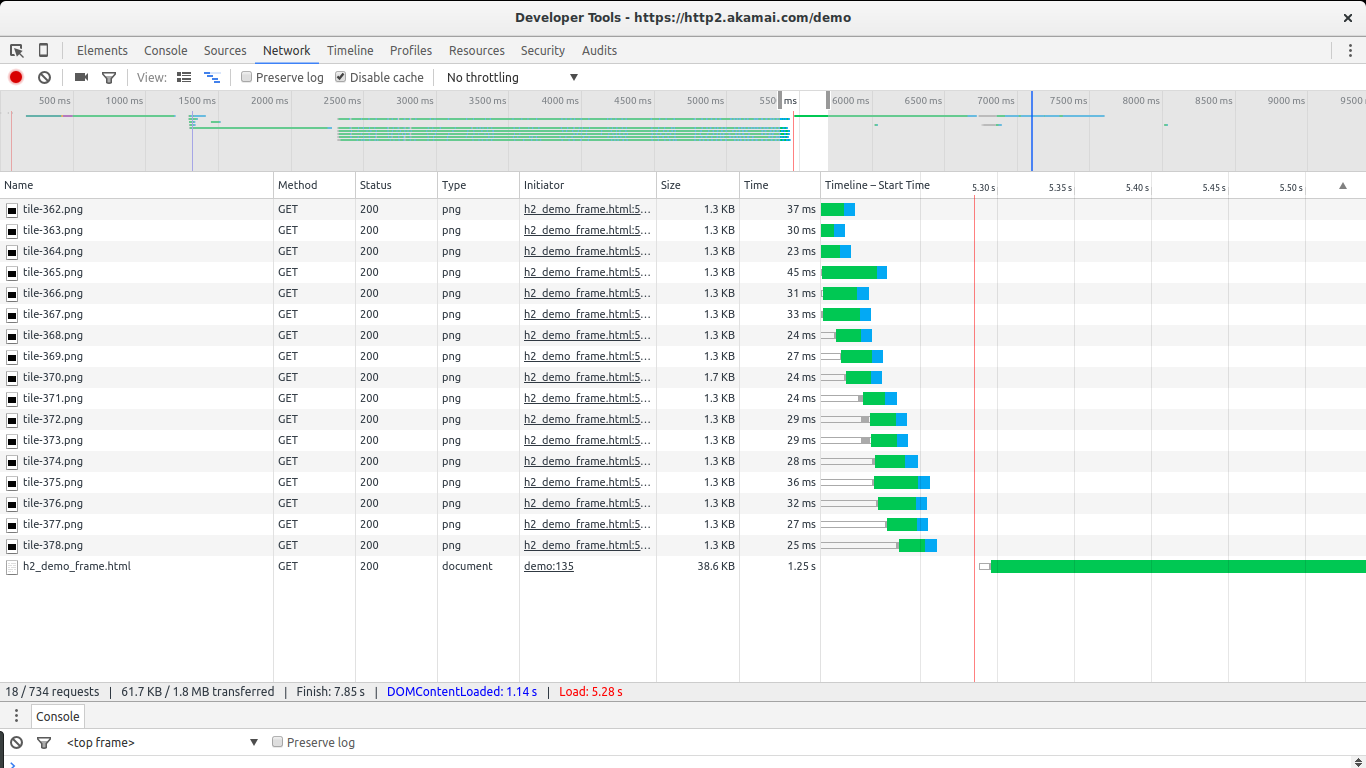
The network view can help identify additional latency generated by slow requests or serial access to an endpoint.
Memory is another area that can result in gains if properly analyzed. If you are running a page with many visual elements (big, dynamic tables) or many interactive elements (for example, games), memory optimization can result in less stuttering and higher framerates. You can find good insights on how to use Chrome’s Dev Tools to do this in this article: 4 Types of Memory Leaks in JavaScript and How to Get Rid Of Them article.
CPU profiling is also available in Chrome Dev Tools. See Profiling JavaScript Performance from Google’s docs.
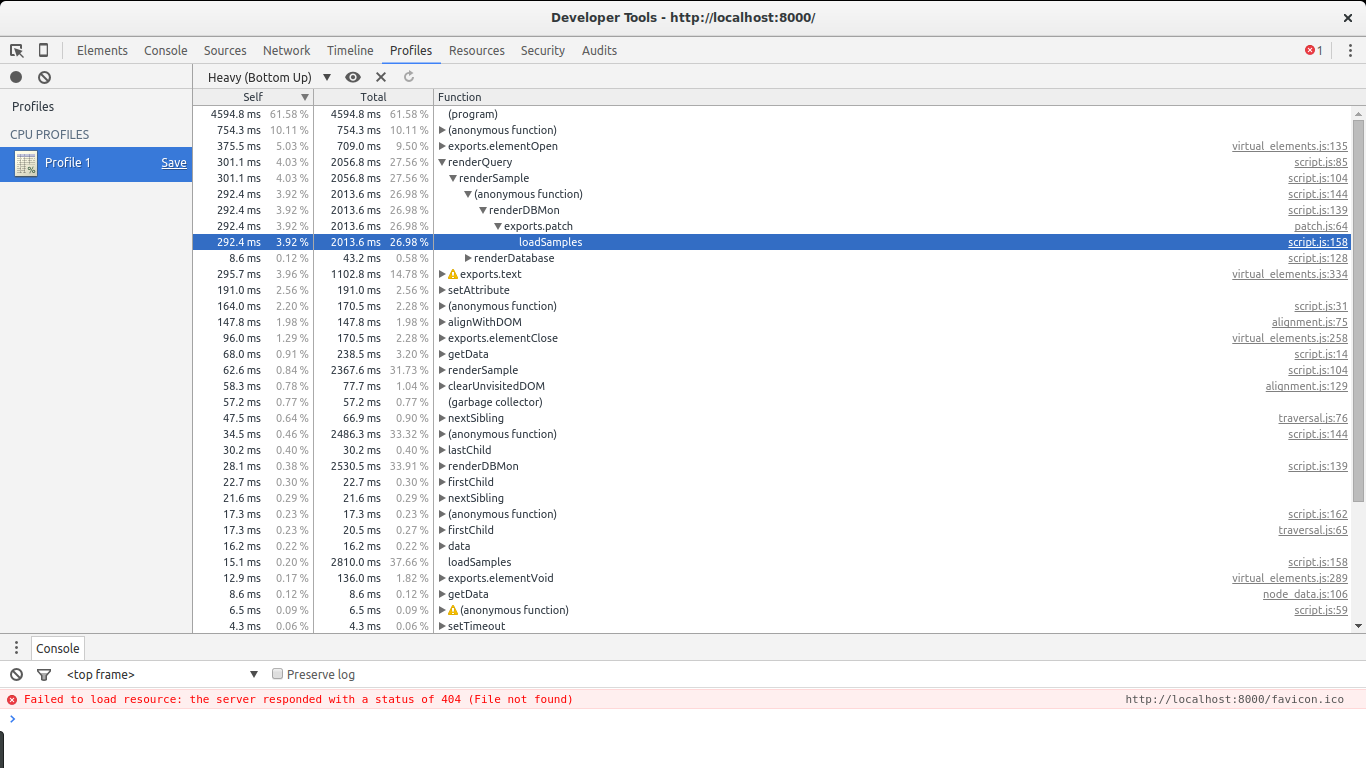
Finding performance cost centers lets you target optimizations effectively. As mentioned earlier, there are a number of tools tht can help in identifying performance bottlenecks and make recommendations on how to address them.
Profiling the backend can be harder. Usually a notion of which requests are taking more time gives you a good idea of which services you should profile first. Profiling tools for the backend depend on which technology stack it was built with.
A note about algorithms #
In a majority of cases picking a more optimal algorithm stands to provide bigger gains than implementing specific optimizations around small cost centers. In a way, CPU and memory profiling should help you find big performance bottlenecks. When those bottlenecks are not related to coding issues, it is time to think about different algorithms.
Use a Load Balancing Solution #
We mentioned content distribution networks (CDNs) briefly when talking about caches. Distributing load among different servers (and even different geographical areas) can go a long way into providing better latency for your users. This is especially true when handling many concurrent connections.
Load balancing can be as simple as a round-robin solution based on a reverse nginx proxy or be based on a full-blown distributed network such as Cloudflare or Amazon CloudFront.
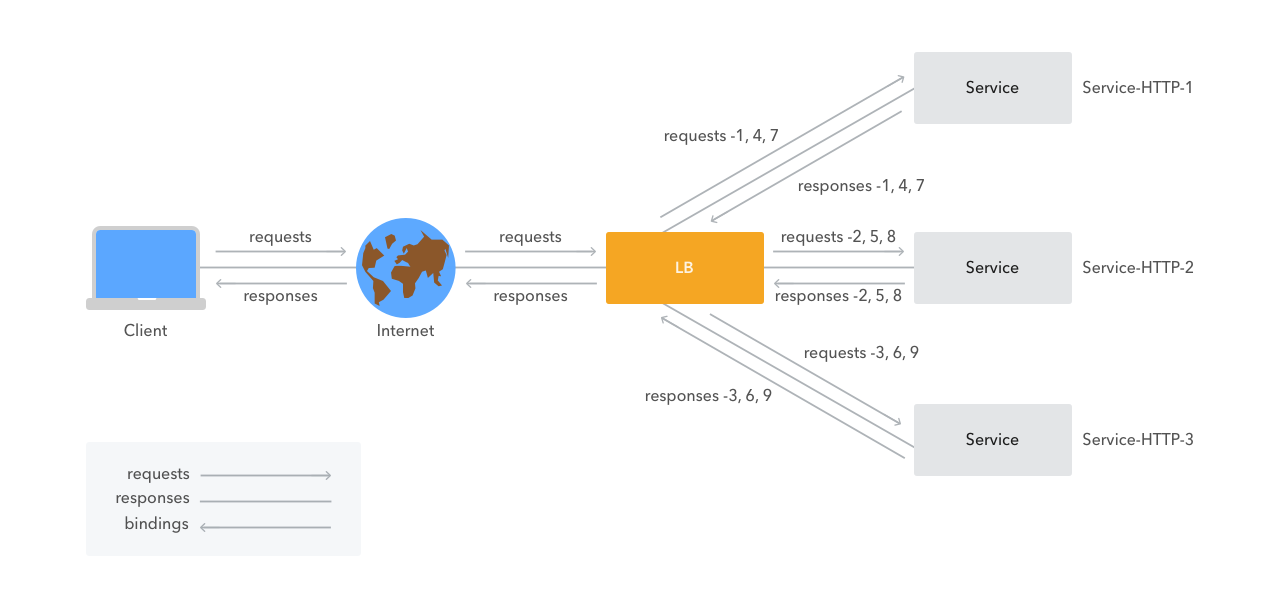
For load-balancing to be really useful, dynamic and static content should be split for easy concurrent access. In other words, serial access to elements impairs the ability of the load balancer to find the best way to split the work. At the same time, concurrent access to resources can improve startup times.
Load balancing can be complex, though. Data models that are not friendly to eventual consistency algorithms or caching make things harder. Fortunately, most apps usually require a high level of consistency for a reduced set of data. If your application was not designed with this in mind, a refactor may be necessary.
Consider Isomorphic JavaScript for Faster Startup Times #
One way of improving the feel of web applications is reducing the startup time or the time to render the first view of the page. This is particularly important in newer single-page applications that do a lot of work on the client-side. Doing more work on the client-side usually means more information needs to be downloaded before the first render can be performed. Isomorphic JavaScript can solve this issue: since JavaScript can run in both the client and the server it is possible for the server to perform the first render of the page, send the rendered page and then have client-side scripts take over. This limits options for the backend (JavaScript frameworks that support this must be used), but can result in a much better user experience. For instance, React can be adapted to do this, as shown in the following code:
var React = require('react/addons');
var ReactApp = React.createFactory(require('../components/ReactApp').ReactApp);

module.exports = function(app) {

    app.get('/', function(req, res){
        // React.renderToString takes your component
        // and generates the markup
        var reactHtml = React.renderToString(ReactApp({}));
        // Output html rendered by react
        // console.log(myAppHtml);
        res.render('index.ejs', {reactOutput: reactHtml});
    });

};
Meteor.js has great support for mixing client side with server side JavaScript:
if (Meteor.isClient) {
  Template.hello.greeting = function () {
    return "Welcome to myapp.";
  };

  Template.hello.events({
    'click input': function () {
      // template data, if any, is available in 'this'
      if (typeof console !== 'undefined')
        console.log("You pressed the button");
    }
  });
}

if (Meteor.isServer) {
  Meteor.startup(function () {
    // code to run on server at startup
  });
}
However, to support server-side rendering, plugins like meteor-ssr are required.
If you have a complex or mid-sized app that supports isomorphic deployments, give this a try. You might be surprised.
Speed up database queries with indexing #
If your database queries are taking too much time to be resolved (profile your app to see if this is the case!), it is time to look for ways to speedup your database. Every database and data-model carries its own trade-offs. Database optimization is a subject in its own: data-models, database types, specific implementation options, etc. Speedups may not be easy. Here is a tip, however, that may help with some databases: indexing. Indexing is a process whereby a database creates fast-access data structures that internally map to keys (columns in a relational database) that can improve retrieval speed of associated data. Most modern databases support indexing. Indexing is not specific to either document-based databases (such as MongoDB) nor relational databases (such as Azure SQL).
To have indexes optimize your queries you will need to study the access patterns of your application: what are the most common queries, on which keys or columns do they perform the search, etc.
Use faster transpiling solutions #
The JavaScript software stack is as complex as ever. This has increased the need for improvements to the language. Unfortunately, JavaScript as a target platform is limited by the runtime of its users. Although improvements have been implemented in form of ECMAScript 2015 (with 2016 in progress) it is usually not possible to depend on this version for client side code. This trend has spurred a series of transpilers: tools that process ECMAScript 2015 code and implement missing features using only ECMAScript 5 constructs. At the same time, module bundling and minification have been integrated into the process to produce what could be called built-for-release versions of the code. These tools transform the code, and can, in a limited fashion, affect the performance of the resulting code. Google developer Paul Irish spent some time looking at how different transpiling solutions affect the performance and size of the resulting code. Although in most cases gains can be small, it is worth having a look at the data before committing to any toolstack. For big applications, the difference might be significant.
Avoid or minimize the use of render blocking JavaScript and CSS #
Both JavaScript and CSS resources can block the rendering of the page. By applying certain rules you can make sure both your scripts and your CSS get processed as quickly as possible so that the browser can display your site’s content.
For the case of CSS it is of the essence that all CSS rules that are not relevant to the specific media on which you are displaying the page are given a lower priority for processing. This can be achieved through the use of CSS media queries. Media queries tell the browser which CSS stylesheets apply to a specific display media. For instance, certain rules that are specific to printing can be given a lower priority than the rules used for displaying on the screen.
Media queries can be set as <link> tag attributes:
<link rel="stylesheet" type="text/css" media="only screen and (max-device-width: 480px)" href="mobile-device.css" />
When it comes to JavaScript, the key lies in following certain rules for inline JavaScript (i.e. code that is inlined in the HTML file). Inline JavaScript should be as short as possible and put in places where it won’t stop the parsing of the rest of the page. In other words, inline HTML that is put in the middle of an HTML tree stops the parser at that point and forces it to wait until the script is done executing. This can be a killer for performance if there are big blocks of code or many small blocks littered through the HTML file. Inlining can be helpful to prevent additional network fetches for specific scripts. For repeatedly used scripts or big blocks of code this advantage is eliminated.
A way to prevent JavaScript from blocking the parser and renderer is to mark the <script> tag as asynchronous. This limits our access to the DOM (no document.write) but lets the browser continue parsing and rendering the site regardless of the execution status of the script. In other words, to get the best startup times, make sure that non-essential scripts for rendering are correctly marked as asynchronous via the async attribute.
<script src="async.js" async></script>
One for the future: use service workers + streams #
A post by Jake Archibald details an interesting technique for speeding up render times: combining service workers with streams. The results can be quite compelling:
Unfortunately this technique requires APIs that are still in flux, which is why it is an interesting concept but can’t really be applied now. The gist of the idea is to put a service worker between a site and the client. The service worker can cache certain data (like headers and stuff that doesn’t change often) while fetching what is missing. The content that is missing can then be streamed to the page to be rendered as soon as possible.
UPDATE: image encoding optimizations #
Both PNGs and JPGs are usually encoded using sub-optimal settings for web publishing. By changing the encoder and its settings, significant savings can be realized for image-heavy sites. Popular solutions include OptiPNG and jpegtran.
A guide to PNG optimization details how OptiPNG can be used to optimize PNGs.
The man page for jpegtran provides a good intro to some of its features.
If you find these guides too complex for your requirements, there are online sites that provide optimization as a service. There are also GUIs such as RIOT that help greatly in doing batch operations and checking the results.
Further reading #
You can read more information and find helpful tools for optimizing your site in the following links:
- Best Practices for Speeding up Your Website - Yahoo Developer Network
- YSlow - a tool that checks for Yahoo’s recommended optimizations
- PageSpeed Insights - Google Developers
- PageSpeed Tools - Google Developers
- HTTP/2: The Long-Awaited Sequel
Conclusion #
Performance optimizations are getting more and more important for web development as applications get bigger and more complex. Targeted improvements are essential to make any optimization attempt worth the time and potential future costs. Web applications have long ago crossed the boundary of mostly static content and learning common optimization patterns can make all the difference between a barely usable application and an enjoyable one (which goes a long way to keeping your visitors!). No rules are absolute, however: profiling and studying the intricacies of your specific software stack are the only way of finding out how to optimize it.

